


Streamlining Project Management: Data Migration & Power BI Integration for Manufacturing Industry
A leading U.S. manufacturing company modernized project reporting by migrating data from Project Online to SQL and integrating Power BI, delivering real-time visibility, accurate financial tracking, and faster data-driven decision-making across large-scale projects.
Faster Reporting
Real-time project insights
Better Data Accuracy
Reliable financial tracking
Quicker Decisions
Actionable business intelligence
Higher Project Visibility
Centralized multi-site dashboards
Challenges
One of the primary challenges was the technical limitations of Power BI, which hindered its ability to automatically connect to new project sites. This restriction led to delays in integrating real-time data from diverse projects, preventing the client from accessing the actionable insights they needed for effective decision-making. Additionally, the lack of seamless integration made it difficult to maintain accurate and up-to-date financial tracking, further complicating their ability to manage resources and monitor project performance efficiently.
These challenges underscored the need for a more robust and flexible solution capable of streamlining data management, enhancing reporting accuracy, and enabling seamless integration across the client’s various project sites.
Solution
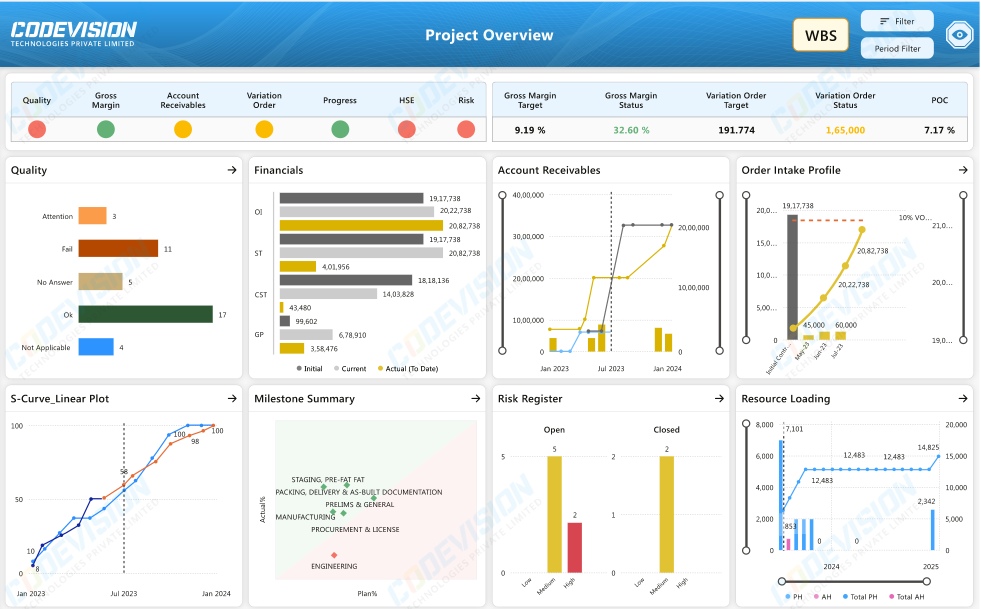
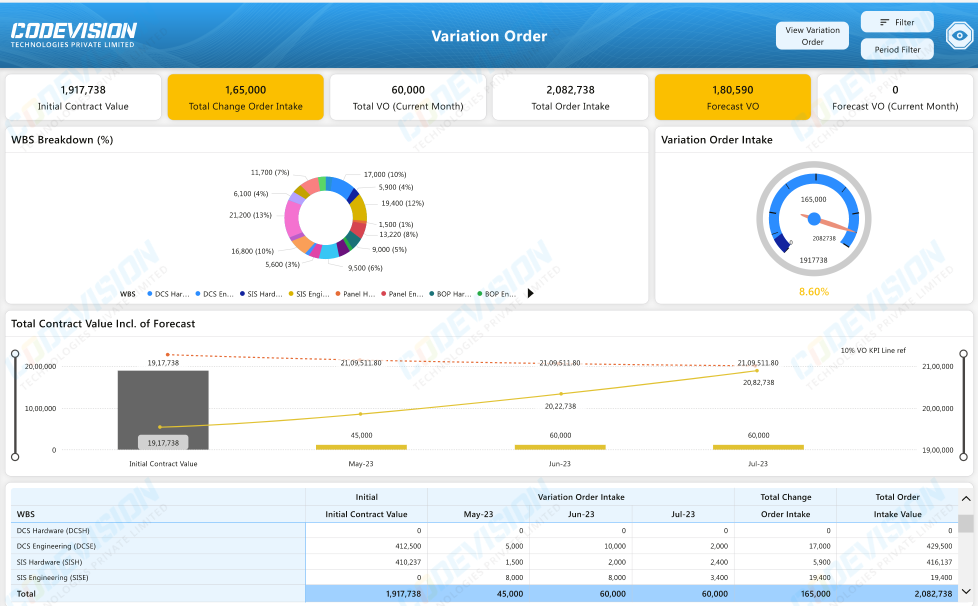
To address the client’s challenges, we implemented a comprehensive solution that involved migrating data from Project Online to SQL, enabling seamless integration for real-time reporting. This migration allowed us to centralize data from multiple projects, offering detailed insights through a Power BI dashboard.
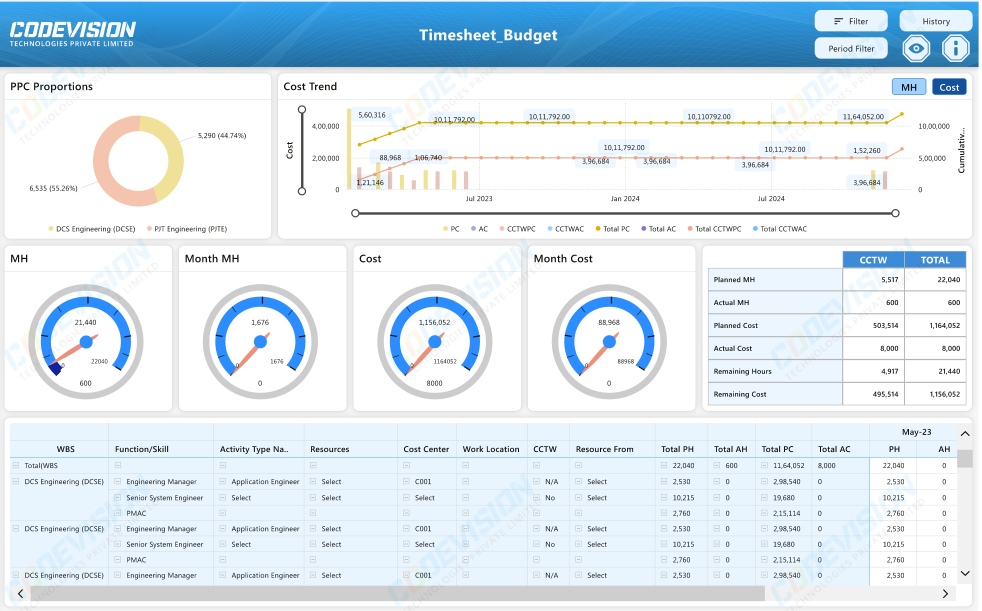
The solution provided the client with a unified view of critical project metrics, including sales and profits, investment tracking (both in money and hours), and the comparison of forecasted versus actual data. Key performance indicators (KPIs) were integrated to assess project progress, and financial data was streamlined to include both initial and current project details.
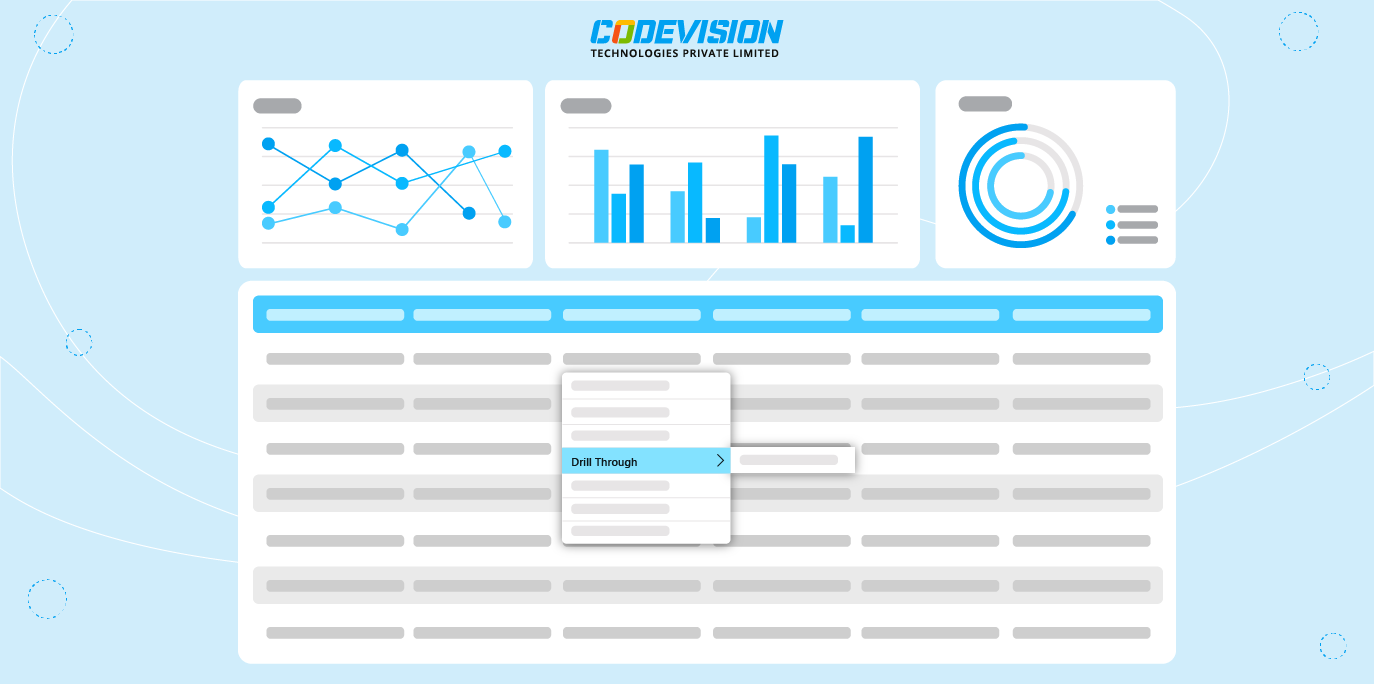
The reporting system consisted of over 30 pages of comprehensive data, divided into more than three key reports, providing a detailed snapshot of all projects. One of the key features of the solution was Power BI’s Cross-Report Drillthrough functionality, allowing users to easily navigate between related reports and drill down into specific data for deeper analysis. This solution significantly enhanced the client’s ability to track and manage their projects more efficiently across their network.
Result
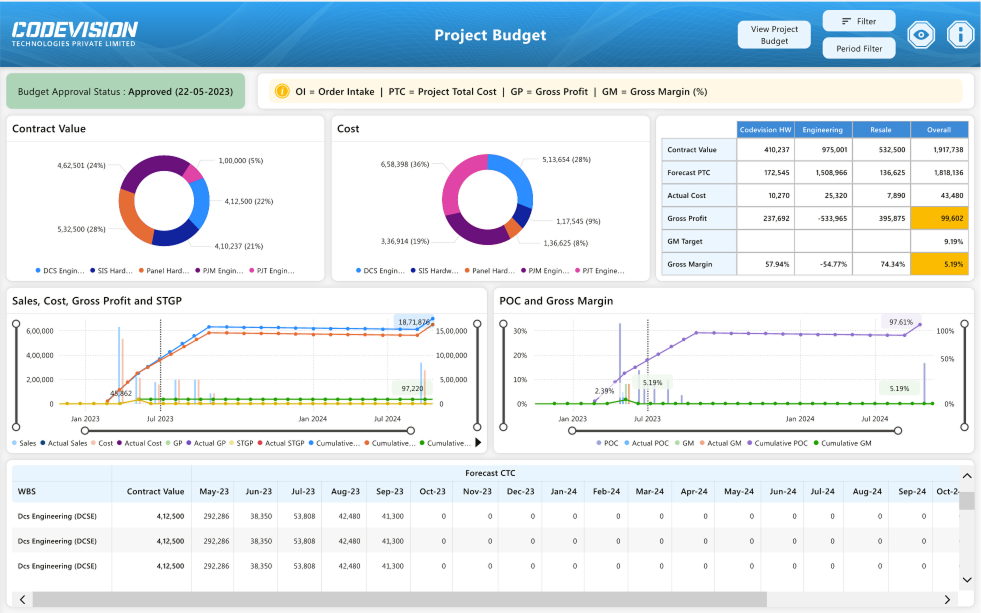
The implementation of the data migration and integration solution had a transformative impact on the client’s ability to manage their projects. The seamless flow of real-time data into Power BI allowed for more accurate reporting and faster decision-making. With centralized insights into project performance, financial status, and key metrics, the client gained a comprehensive view of their operations, improving both efficiency and strategic planning. This solution not only enhanced the client’s ability to track project progress across multiple sites but also empowered them to make data-driven decisions, ultimately supporting the successful management of their large-scale initiatives.
Key Features

Data Migration from Project Online to SQL
Comprehensive Power BI Dashboard
Key Performance Indicators (KPIs)
Cross-Report Drillthrough Functionality
Comprehensive Financial Tracking
Improved Project Tracking Across Multiple Sites
Related Case Studies


Automating KPI Reporting for Fabrication Projects: A Power Platform Success Story
Discover how an Australian fabrication company transformed its KPI reporting with Power Platform. Learn how automated data extraction and real-time dashboards enhanced production visibility, accuracy, and scalability.


Microsoft Power Platform for Healthcare Industry
Software Solution based on Microsoft Power Platform and SharePoint modern interface to help USA Based Home Healthcare Service proving company.


Application Tracking Solution
Client is the world’s most prominent leading provider company and highly efficient transport solutions for the environmental service industry and commercial vehicles. They have more than 20,000+ global customers and a 40% global market share with 12 production areas across China, India, Brazil, and Europe.
