+1 (408) 900-9133
Power BI vs Tableau vs Looker: Choosing the Right BI Tool for Your Business

-
Ashish Chotalia
-
08 Sep, 2025

-
Power BI

In today’s data-driven world, businesses need more than just raw data—they need actionable insights. Business Intelligence (BI) tools like Power BI, Tableau, and Looker are transforming the way organizations analyze performance, understand customer behavior, and plan for the future. Choosing the right BI tool is not just a technical decision; it’s a strategic choice that can impact productivity, efficiency, and ROI.
At Codevision Technologies, we help enterprises navigate the BI landscape and select tools that align with their industry, digital transformation goals, and growth stage. This comprehensive guide explores the strengths, weaknesses, and ideal use cases for Power BI, Tableau, and Looker, helping you make an informed decision.
Why the Right BI Tool Matters
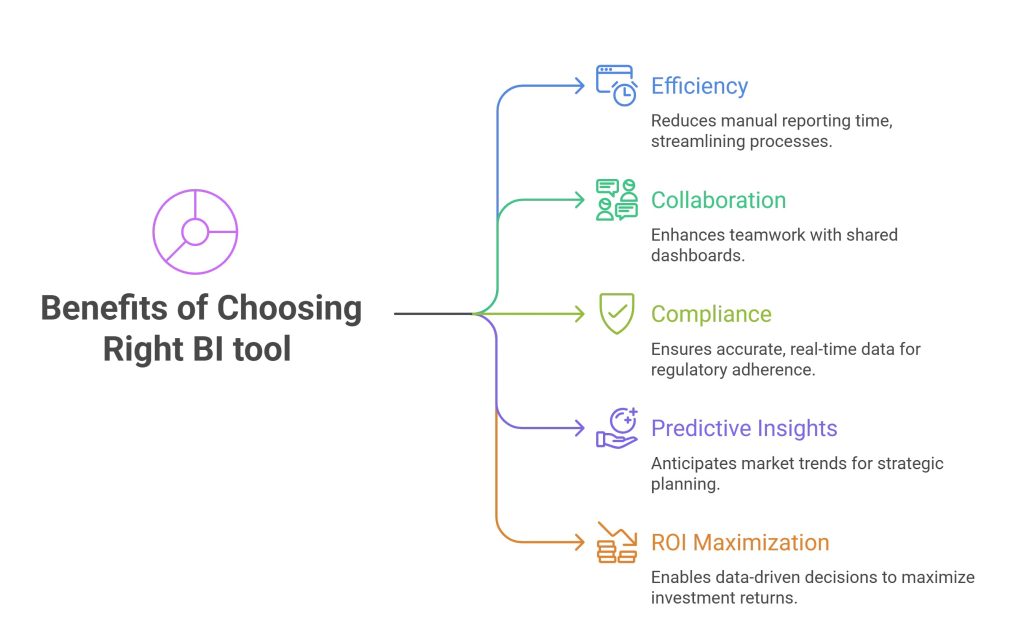
Selecting the right BI solution goes beyond functionality. The right tool can:
- Drive efficiency by reducing time spent on manual reporting.
- Enhance collaboration across departments with shared dashboards.
- Ensure compliance with accurate, real-time data.
- Enable predictive insights that help anticipate market trends.
- Maximize ROI by enabling data-driven decisions.
1. Power BI: The Microsoft Analytics Ecosystem Advantage
Overview:
Power BI is a cloud-first BI tool designed for businesses of all sizes, particularly those already invested in the Microsoft ecosystem. It integrates seamlessly with Office 365, Excel, Teams, and Azure, offering a cost-effective, scalable solution.
Key Highlights:
- Cost-Effective Licensing: Ideal for SMBs and enterprise users on a budget.
- AI-Powered Features: Natural language queries, predictive analytics, and cognitive services.
- Data Connectivity: Over 100 native connectors, including SQL, Excel, Salesforce, and Google Analytics.
- Mobile-Ready Dashboards: Optimized for access on smartphones and tablets.
Best Use Cases:
- Internal reporting and finance dashboards for SMBs.
- Sales and marketing analytics integrated with Microsoft Teams.
Also Read Case Study – Streamlining Project Management: Data Migration & Power BI Integration for Manufacturing Industry
2. Tableau: The Data Storytelling Champion
Overview:
Tableau is renowned for its visual storytelling capabilities. Its intuitive drag-and-drop interface and advanced analytics enable organizations to create interactive dashboards that drive better decision-making.
Key Highlights:
- Visualization Excellence: Extensive library of charts, maps, and interactive reports.
- Strong Scalability: Handles large datasets efficiently for enterprise needs.
- Cross-Industry Adoption: Trusted in healthcare, finance, retail, education, and government.
- Community Ecosystem: Access to Tableau Public, forums, and training resources.
Best Use Cases:
- Executive dashboards with advanced visualizations.
- Cross-department analytics for large enterprises.
3. Looker: The Modern Embedded Analytics Platform
Overview:
Looker, part of Google Cloud, focuses on modern BI, embedded analytics, and governed data modeling. Its LookML modeling language ensures consistent metrics, while its cloud-native architecture supports scalable, near real-time analytics.
Key Highlights:
- LookML Modeling: Ensures consistent business metrics across the organization.
- Cloud-Native Infrastructure: Optimized for BigQuery, Snowflake, and Redshift.
- Embedded Analytics: Dashboards can be integrated into portals and applications.
- Collaboration Focus: Shareable dashboards with real-time collaboration.
Best Use Cases:
- SaaS platforms embedding analytics for customers.
- Operational dashboards with modern data warehouses.
Comparative Analysis: Power BI vs Tableau vs Looker
| Criteria | Power BI | Tableau | Looker |
|---|---|---|---|
| Best For | SMBs, Microsoft ecosystem users | Enterprises, data storytelling | Cloud-first businesses, embedded analytics |
| Ease of Use | Beginner-friendly | Drag-and-drop simplicity | Moderate, requires LookML knowledge |
| Cost | Affordable | Higher licensing costs | Premium pricing |
| Integrations | Microsoft ecosystem, 100+ sources | Nearly all major platforms | Google Cloud, BigQuery, APIs |
| Visualization | Strong, but secondary | Industry leader | Good, more modeling-focused |
| AI & Predictive Models | Built-in, strong | Limited without add-ons | Robust via LookML and custom ML |
| Scalability | Moderate to high | Enterprise-grade | Cloud-native, highly scalable |
How to Choose the Right BI Tool
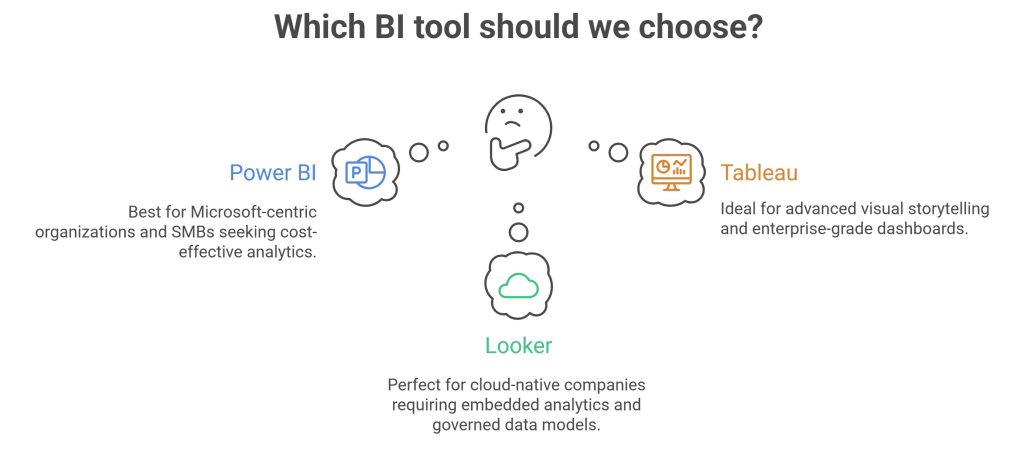
- Power BI → Best if you are a Microsoft-centric organization or SMB seeking cost-effective analytics.
- Tableau → Ideal if you need advanced visual storytelling and enterprise-grade dashboards.
- Looker → Perfect for cloud-native companies requiring embedded analytics and governed data models.
Final Thoughts
The right BI tool can transform your data into strategic insights, driving efficiency, collaboration, and informed decision-making across your organization. By understanding your business needs, technical requirements, and budget, you can select the solution that delivers the most value.
For organizations already invested in the Microsoft ecosystem, Power BI offers a seamless, cost-effective way to turn your data into actionable insights. Unlock dashboards, predictive analytics, and AI-driven features that empower your team to make smarter decisions faster.
At Codevision Technologies, we guide businesses in adopting the right BI solutions—whether it’s Power BI, Tableau, or Looker—to achieve measurable growth and operational excellence.
Frequently Asked Questions
Power BI is ideal for SMBs and Microsoft-centric organizations, offering cost-effective analytics and AI-driven features. Tableau excels in data visualization and storytelling for large enterprises. Looker is cloud-native, designed for embedded analytics and governed data models.
Power BI is often the preferred choice for small-to-medium businesses due to its affordability, easy integration with Microsoft tools, and beginner-friendly interface.
Tableau is widely used in enterprises for its advanced visualization capabilities and scalability. Looker is also suitable for cloud-native enterprises needing embedded analytics.
Power BI is generally beginner-friendly, Tableau has a drag-and-drop interface suitable for non-technical users, while Looker requires knowledge of LookML for advanced modeling.
Yes. Power BI supports near real-time dashboards with streaming datasets. Tableau can display live data connections, and Looker’s cloud-native architecture is optimized for near real-time analytics.
- Power BI: Integrates with Office 365, Excel, Teams, Azure, and over 100+ data sources.
- Tableau: Connects to nearly all major data platforms, including databases, cloud services, and APIs.
- Looker: Integrates seamlessly with Google Cloud, BigQuery, Snowflake, and APIs for embedded analytics.
Power BI has built-in AI and predictive modeling features. Looker allows robust predictive analytics via LookML and custom ML integration. Tableau supports AI via add-ons like Einstein Discovery.
Consider your organization’s size, technical expertise, cloud or on-premise preference, need for advanced visualizations, and budget. Power BI is great for Microsoft-centric organizations, Tableau excels in visual storytelling, and Looker suits cloud-first businesses with embedded analytics needs.
Yes. Power BI integrates with Teams for collaborative reporting. Tableau offers sharing via Tableau Server or Tableau Online. Looker allows dashboards to be shared and embedded for real-time team collaboration.

Microsoft Copilot vs Google Gemini — The Future of AI-Powered Productivity